-
1 временная гистограмма
Quality control: time bar graphУниверсальный русско-английский словарь > временная гистограмма
-
2 столбчатая диаграмма
Русско-английский новый политехнический словарь > столбчатая диаграмма
-
3 столбиковая диаграмма
1. bar diagram2. bar chartвычислительная диаграмма, номограмма — calculating chart
3. bar graph4. column diagramРусско-английский большой базовый словарь > столбиковая диаграмма
-
4 светодиодная шкала
светодиодная шкала
линейный индикатор
-
[Интент]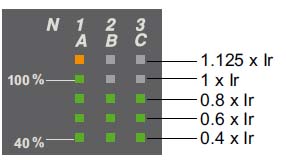
Рис. Schneider ElectricПараллельные тексты EN-RU
A bargraph on the front of the control unit continuously displays the currents measured on phases 1, 2 and 3 as a percentage of the long-time current setting Ir.
[Schneider Electric]Светодиодная шкала, расположенная на лицевой панели расцепителя, непрерывно отображает измеренные токи в фазах 1, 2 и 3, в процентах от уставки тока Ir защиты с длительной задержкой срабатывания.
[Перевод Интент]
Тематики
Синонимы
EN
Русско-английский словарь нормативно-технической терминологии > светодиодная шкала
-
5 линейный график
гистограмма, столбчатый график — bar graph
Бизнес, юриспруденция. Русско-английский словарь > линейный график
-
6 иллюстративный график
гистограмма, столбчатый график — bar graph
Бизнес, юриспруденция. Русско-английский словарь > иллюстративный график
-
7 количественный график
гистограмма, столбчатый график — bar graph
Бизнес, юриспруденция. Русско-английский словарь > количественный график
-
8 график
1) General subject: diagram, figure, graph, graphic artist, schedule, time schedule (дежурств), time-bill, timetable (работы, движения поездов и т.п.), time-table2) Computers: line chart8) Construction: abacus, alignment chart9) Mathematics: plot, reciprocal spiral10) Railway term: log11) Economy: calendar, organization plan12) Accounting: map13) Polygraphy: graphic designer14) Electronics: line graph15) Information technology: schedule (календарный)16) Oil: graphical chart17) Cartography: diagrammatic curve, pictogram19) Silicates: line20) Metrology: waveform21) Drilling: program22) Oilfield: flow chart (проведения работ), schedule program (проведения работ)24) Quality control: (календарный) schedule25) Oceanography: (морской) chart26) Cables: time-schedule27) Psychoanalysis: shedule28) Makarov: chart (изображение), coordinate graph, curve (изображение), diagram (изображение), graph (изображение), graphic, plot (изображение), record, recording, schedule (расписание), tracing -
9 циклограмма
1) Mathematics: cyclogram2) Polygraphy: timing chart3) Information technology: mission profile (выполняемого задания)4) Astronautics: cyclic graph, sequence, time history5) Mechanics: actigram6) Automation: bar-and-pic chart, control chart, cyclogram (машины)7) Robots: actigram (выполняемых действий), cycle scheme, cycle sheet, cycle timing, multiple activity diagram8) Chemical weapons: time and motion diagram9) Makarov: cyclogram (1. графическое изображение процесса установления колебаний в автогенераторе 2. диаграмма согласования действий исполнительных органов в системах, работающих по заданному циклу), cyclogram (о временном цикле), sequence diagram, timing diagram (о временном цикле) -
10 диаграмма
chart, diagram, graph, pattern, plan, plot, ( самописца) chart record, record, recording, schematic, scheme, sheet, template геофиз.* * *диагра́мма ж.1. diagram, plot2. ( диаграммная бумага) chartдиагра́мма фикси́руется вту́лкой о́си — the chart is located by a hubдиагра́мма в дека́ртовых координа́тах — Cartesian diagramве́кторная диагра́мма — vector diagramдиагра́мма в поля́рных координа́тах — polar diagramдиагра́мма в прямоуго́льных координа́тах — diagram in rectangular coordinatesвременна́я диагра́мма — time diagram; time [timing] chartдиагра́мма газораспределе́ния ( в двс) — distribution [timing] diagramдиагра́мма да́льности де́йствия радио, рлк. — coverage diagramдиагра́мма деформа́ций — strain diagramдиагра́мма для самопи́сцев — chartдиагра́мма для самопи́сцев, кру́глая — circular chartдиагра́мма для самопи́сцев, ле́нточная — strip chartдиагра́мма затвердева́ния — solidification curveдиагра́мма излуче́ния по по́лю — radiation field patternдиагра́мма изодо́з — isodose chartдиагра́мма изотерми́ческих превраще́нии — isothermal transformation diagramиндика́торная диагра́мма — indicator diagram, метал. force-distance diagramдиагра́мма испыта́ния ( материалов) — test diagramдиагра́мма истече́ния — effluogramдиагра́мма и́стинности киб. — truth diagramконструкти́вная диагра́мма — assumption diagramкругова́я диагра́мма — circle [locus] diagramкругова́я, ве́кторная диагра́мма — clock diagramлине́йная диагра́мма — line diagramдиагра́мма металлурги́ческих равнове́сий — metallurgical equilibrium diagramдиагра́мма нагру́зки свз. — traffic diagramдиагра́мма напра́вленности анте́нны1. ( графическое представление) directional [radiation] pattern, directivity [polar] diagramстро́ить диагра́мму напра́вленности анте́нны — construct a directional [radiation] pattern2. ( луч антенны) beamвраща́ть диагра́мму напра́вленности анте́нны — rotate a beamиспо́льзовать широ́кую или у́зкую диагра́мму напра́вленности анте́нны — use a wide or narrow beamуправля́ть диагра́ммой напра́вленности анте́нны по а́зимуту, да́льности, углу́ ме́ста — control a beam in azimuth, range, elevationформирова́ть диагра́мму напра́вленности анте́нны — shape a beamдиагра́мма напра́вленности анте́нны, азимута́льная — azimuth directional [radiation] patternдиагра́мма напра́вленности анте́нны, асимметри́чная — asymmetric directional [radiation] patternдиагра́мма напра́вленности анте́нны, асимметри́чная треуго́льная — asymmetrically flared beamдиагра́мма напра́вленности анте́нны в вертика́льной пло́скости — vertical directional [radiation] pattern [beam]диагра́мма напра́вленности анте́нны в горизонта́льной пло́скости — horizontal directional [radiation] pattern [beam]диагра́мма напра́вленности анте́нны, ве́ерная1. fan-shaped directional [radiation] pattern2. fan-shaped beamдиагра́мма напра́вленности анте́нны, двухлучева́я — bidirectional beamдиагра́мма напра́вленности анте́нны, иго́льчатая1. pencil-beam directional [radiation] pattern2. pencil beamдиагра́мма напра́вленности анте́нны, кардио́идная — cardioid directional [radiation] patternдиагра́мма напра́вленности анте́нны, квадрати́чно-косе́кансная — cosecant-squared beamдиагра́мма напра́вленности анте́нны, лопастеобра́зная — beavertail beamдиагра́мма напра́вленности анте́нны, многолепестко́вая1. multilobe directional [radiation] pattern2. multilobed beamдиагра́мма напра́вленности анте́нны на приё́м — reception directional [radiation] patternдиагра́мма напра́вленности анте́нны, ножева́я — knife-edge pattern [beam]диагра́мма напра́вленности анте́нны, се́кторная1. sector-shaped directional [radiation] pattern2. sector-shaped beamдиагра́мма напра́вленности анте́нны, треуго́льная1. flat-top directional [radiation] pattern2. flat-top flared beamдиагра́мма напра́вленности облуча́теля — feed directional [radiation] patternдиагра́мма напра́вленности радиотелеско́па — radio telescope beamдиагра́мма напряже́ний — stress-strain diagramдиагра́мма напряжё́нности по́ля — field strength patternдиагра́мма неопределё́нности — ambiguity diagramдиагра́мма осто́йчивости — stability curveдиагра́мма парораспределе́ния ( паровой машины) — valve diagramдиагра́мма пла́вкости — fusibility curveдиагра́мма плавле́ния — melting-point diagramдиагра́мма по́ля — field patternполя́рная диагра́мма — polar diagramпотенциа́льная диагра́мма — potential diagramдиагра́мма превраще́ний — transformation diagramпсихрометри́ческая диагра́мма — psychrometric chartдиагра́мма равнове́сия — equilibrium diagramдиагра́мма распределе́ния нагру́зки — loading chartдиагра́мма распределе́ния освещё́нности — isocandle diagramдиагра́мма распределе́ния пото́ка — flux patternдиагра́мма раствори́мости — solubility diagramдиагра́мма режи́мов ( паровой турбины) — steam-consumption diagramдиагра́мма рекристаллиза́ции — recrystallization curveсво́дная диагра́мма — cumulative diagramдиагра́мма скоросте́й — velocity diagramдиагра́мма слы́шимости — audition diagramдиагра́мма сопротивле́ний и проводи́мостей — immittance chartдиагра́мма состоя́ния — constitution diagramдиагра́мма состоя́ния двухкомпоне́нтной систе́мы — binary constitution diagramдиагра́мма состоя́ния, неравнове́сная — metastable diagramдиагра́мма состоя́ния тройны́х спла́вов — ternary constitution diagramсто́лбчатая диагра́мма — column [bar] diagram, histogramтеплова́я диагра́мма — thermal diagramтермокинети́ческая диагра́мма — continuous cooling transformation diagramдиагра́мма ти́пов колеба́ний — mode chartтопографи́ческая диагра́мма — topographical diagramто́чечная диагра́мма — point-by-point diagram, point-by-point plotдиагра́мма тра́фика — traffic curve, traffic recordтрёхо́сная диагра́мма — triaxial diagramузлова́я диагра́мма — nodal diagramдиагра́мма фаз газораспределе́ния двс. — distribution [timing] diagramфа́зовая диагра́мма — phase diagramфотометри́ческая диагра́мма — isocandle diagramдиагра́мма ци́кла дви́гателя — cycle curveциклова́я диагра́мма — cyclogramшта́пельная диагра́мма текст. — fibre (array) [staple] diagramэнергетиче́ская диагра́мма — energy (level) diagramдиагра́мма энергети́ческих у́ровней — energy-band diagramэнтропи́йная диагра́мма — entropy(-temperature) diagram
См. также в других словарях:
Bar chart — See also: Histogram Example of a bar chart, with Country as the discrete data set. A bar chart or bar graph is a chart with rectangular bars with lengths proportional to the values that they represent. The bars can be plotted vertically or… … Wikipedia
graph — /graf, grahf/, n. 1. a diagram representing a system of connections or interrelations among two or more things by a number of distinctive dots, lines, bars, etc. 2. Math. a. a series of points, discrete or continuous, as in forming a curve or… … Universalium
bar chart — A chart that graphs the high, low, and settlement prices for a specific trading session over a given period of time. Chicago Board of Trade glossary A graphic representation of price movement disclosing the high, low, close, and sometimes the… … Financial and business terms
bar — 1. bar [ bar ] n. m. • 1857; bar room 1833; mot angl. « barre de comptoir », puis « comptoir » 1 ♦ Débit de boissons où l on consomme debout, ou assis sur de hauts tabourets, devant un long comptoir. Faire la tournée des bars. Fam. Pilier de bar … Encyclopédie Universelle
Bullet graph — A bullet graph is a variation of a bar graph developed by Stephen Few. Seemingly inspired by the traditional thermometer charts and progress bars found in many dashboards, the bullet graph serves as a replacement for dashboard gauges and meters.… … Wikipedia
Peristimulus time histogram — In neurophysiology, peristimulus time histogram and poststimulus time histogram, both abbreviated PSTH or PST histogram, are histograms of the times at which neurons fire. These histograms are used to visualize the rate and timing of neuronal… … Wikipedia
Glossary of graph theory — Graph theory is a growing area in mathematical research, and has a large specialized vocabulary. Some authors use the same word with different meanings. Some authors use different words to mean the same thing. This page attempts to keep up with… … Wikipedia
Interval graph — In graph theory, an interval graph is the intersection graph of a set of intervals on the real line. It has one vertex for each interval in the set, and an edge between every pair of vertices corresponding to intervals that intersect.Formally,… … Wikipedia
Conductance (graph) — For other uses, see Conductance. In graph theory the conductance of a graph G=(V,E) measures how well knit the graph is: it controls how fast a random walk on G converges to a uniform distribution. The conductance of a graph is often called the… … Wikipedia
Scene graph — A scene graph is a general data structure commonly used by vector based graphics editing applications and modern computer games. Examples of such programs include AutoCAD, Adobe Illustrator, Acrobat 3D, OpenSceneGraph and CorelDRAW.The scene… … Wikipedia
statistics — /steuh tis tiks/, n. 1. (used with a sing. v.) the science that deals with the collection, classification, analysis, and interpretation of numerical facts or data, and that, by use of mathematical theories of probability, imposes order and… … Universalium